

What is going on in South Africa?
Omicron numbers make little sense.

I’ve been following COVID data around the world since early 2020. From what I have seen so far, the data given by South African authorities raises big concerns. The data doesn’t fit a pattern seen before and it behaves in a way that contradicts common sense. I might be wrong, but I only find two non-mutually exclusive explanations for it:
Omicron is spreading among the population by unnatural means different that person to person, or South African authorities are forging the numbers by adjusting the PCR cycle threshold.
Cases in Gauteng are increasing too fast and suddenly stopped.
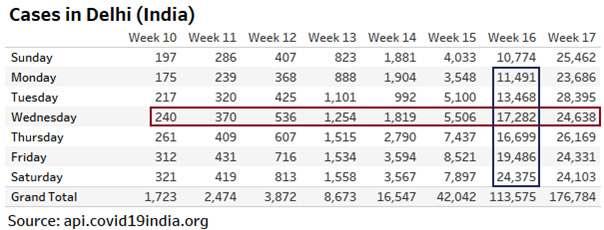
South Africa’s omicron outbreak epicenter is Gauteng. Covid cases are growing exceptionally fast. Cases grew 100-fold in a 4-week period, from 120 to 12,000. To give a context, in the worst outbreak in Delhi (India), cases also grew 100-fold, from 240 to 24,000, but in a seven-week period. The spread in Delhi was half the one in Gauteng even though Delhi has three times more population than Johannesburg (Gauteng capital city), and the population density is 2.5 times higher.[i]

During the last 10 days, case growth in Gauteng stopped and has been close or under 12,000. Delhi’s health system was under enormous pressure. The city started a strict lock down and implemented a robust isolation and treat program. The program brought cases a down few weeks later. Gauteng doesn’t have mobility restrictions or a program to isolate and treat patients. This lack of strategy makes me believe that the recent stop in the surge inconsistent.
Testing in South Africa: Illogical patterns.
Before November 25, South Africa tested about 25,000 people per day and the positivity rate was close to 1%. The first week of December, testing crossed 100,000 samples per day and positivity reached 30%.
Positivity rates are growing at unusual patterns. It isn’t normal to climb from 2% to 10% from one week to the next, stay few days around 10% and go up again to 24% the next week. This pattern seems more a tweak in testing than an organic growth. These increases produce even more distrust, knowing that testing numbers are also growing quick.

Another unusual pattern is the stability in the positivity rate when the number of tests change. A rapid surge in cases could explain the simultaneous increase in positivity and testing. But it is inexplicable a steady positivity when test reduces by a large quantity. On December 4, testing 69k people, the positivity rate was 24%. The next day, testing dropped to 47k, and the positivity remained the same. One day later, tests dropped even more to 24k, and positivity increased only to 26%. Two days later, testing jumped to 75k, and positivity reached 30%.

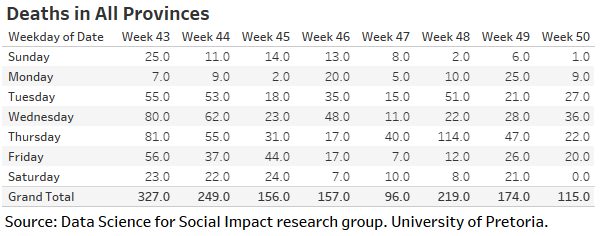
Covid fatalities in South Africa:
Covid fatalities don’t show an increase. Cases rose five weeks ago and deaths haven’t moved. It is very unusual because South Africa’s three previous waves cases and deaths raised simultaneously .
Bottom Line, numbers in South Africa, makes little sense. There are big inconsistencies regarding cases, positivity, testing, and deaths. The data makes Omicron the variant of paradoxes.
Final Open question:
On October 28, 2021, the WHO meet and decided to invest $US 23.4 billion to solve inequities’ in the access to vaccines, tests, and treatments.[ii] Is there any connection between a program to invest in vaccines, testing and treatment and the sudden explosive outbreak that increases the demand for vaccines, tests, and treatments?
Thanks for your analysis. From a layman’s POV, the PCR test is and has been ripe for manipulation. So much of the fear narrative and so much of the data depends on PCR data taken at face value as accurate & valid. If even a small amount of it is not, the narrative cannot be supported. So it would not surprise me at all it PCR tests are either are outside any control parameter or are being manipulated to try and achieve some result. Or both.
thanks for analyzing this! the fear mongering around Omicron has been non-stop and South Africa has been the main example friends and family point to as a way to propagate fear and distrust.